
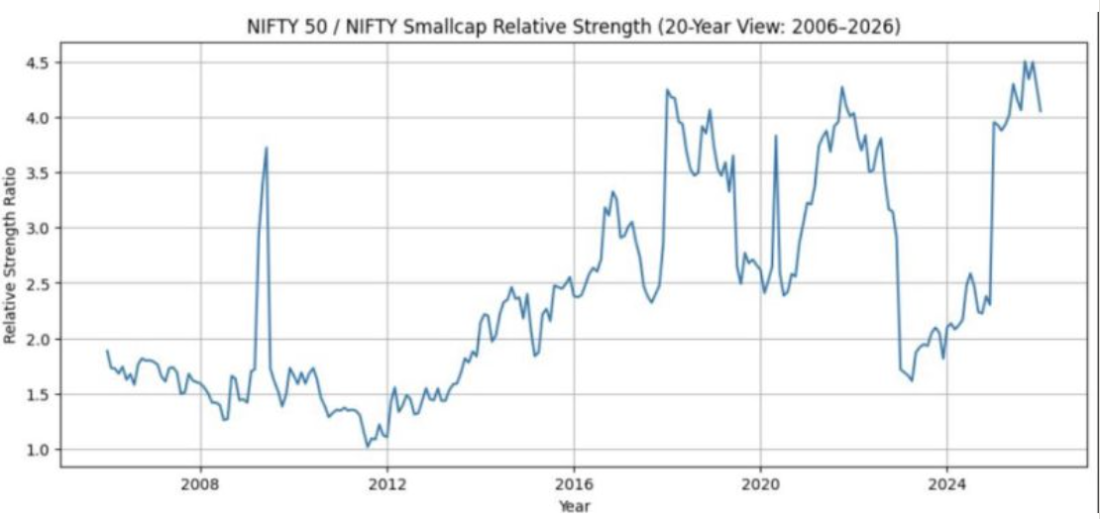
The graphic above shows the ratio between the Nifty 50 and the Small Cap Index over the last 20 years.
This ratio is a simple way to track market leadership.
When the ratio falls, small caps outperform large caps, reflecting rising risk appetite.
When the ratio rises, large caps outperform, signalling caution and lower risk-taking in the market.
Over two decades, this chart has moved in clear cycles, repeatedly showing that leadership in markets never remains permanent.
• 2004–2008: Strong liquidity and optimism drove massive small-cap outperformance.
• 2008–2010: Post global financial crisis, investors preferred stability and large caps regained leadership.
• 2010–2012: Risk appetite returned and small caps again dominated.
• 2018–2020: Mean reversion followed, favouring large caps.
• 2020–September 2024: One of the strongest small-cap rallies in recent history, powered by liquidity, participation and expanding risk appetite.
September 2024 marked an important turning point.
Indian markets peaked with small caps significantly outperforming large caps. Since then, small caps have corrected while large caps have remained relatively resilient.
As a result, the ratio has started moving upward, indicating a decline in risk-taking ability across the market.
Historically, rising ratios reflect phases where investors prefer earnings visibility, balance-sheet strength and relative safety over high-beta opportunities(large cap over small cap)
Now the interesting part.
The ratio is again at elevated levels, suggesting risk appetite toward small caps is currently low(CNX Small Cap index is down by more that 30% from ATH)
And market history often poses a contrarian question at such moments
When risk appetite disappears, does the next phase of small-cap outperformance has begun to start forming?
The chart does not predict certainty.
But it helps us understand where we may stand in the market cycle.
Investing success often comes not from chasing leadership, but from recognising when leadership is quietly preparing to change.
Disclaimer: This is only for educational purposes and not an investment advice of any kind
Very informative and easy to understand.